Point of Control Trading Guide: How to Trade the POC
The Point of Control — almost always shortened to POC — is the single most-traded price within a given session, range or distribution. On a volume profile it appears as the longest horizontal bar. On a market profile, it sits at the widest row of TPOs. Either way, it points at one specific number on the y-axis: the price the market kept coming back to, the price where buyers and sellers spent the most time agreeing on fair value. For an auction-driven trader, that number is one of the few levels worth marking on the chart every single day.
This guide unpacks what the POC actually represents, how it gets calculated, the magnet behaviour traders try to exploit, the special case of “naked” or untested POCs, and three repeatable setups you can take from the level itself.
What the Point of Control Actually Tells You
Markets are auctions. Price moves up and down looking for a level where buyers and sellers will trade, and when it finds one, volume piles up. The POC is the single price level inside that auction where the most contracts changed hands. It is a measure of acceptance — proof that both sides agreed this was fair value, at least for the period being measured.
That is a different signal from a swing high or a moving average. A swing high is a rejection; a 50-period EMA is a smoothed average. The POC is neither — it is a statement about where the market spent its time and money. When price drifts back to that level later, the auction is asking the same question it asked before: is this still fair? The answer the market gives at that moment is what the POC trader is listening for.
If the answer is “yes” — buyers step in, the level holds — you have support. If the answer is “no” — sellers absorb the bid and price punches through — you have a failed level and often a fast move to the next high-volume node. Both outcomes are tradeable. Neither is random.
How the POC Is Calculated
Conceptually the POC is trivial: bucket every trade by price, sum the contracts at each price, find the price with the highest sum. In practice, three details matter.
First, bucket size. A futures contract that ticks every 0.25 will have hundreds of distinct prices in a session. Charting platforms group nearby ticks into rows so the profile is readable. A wider row makes the POC easier to see but smears precision; a narrower row sharpens the level but creates noise. GoCharting lets you set this row size manually so you can match it to the instrument’s tick value and your trade horizon.
Second, session boundary. A daily POC, a weekly POC and a “since-last-major-low” composite POC will sit at different prices and tell you different things. Day traders watch the developing POC as the session unfolds. Swing traders care about weekly composites. Position traders look at composite profiles built around major swings.
Third, what counts as volume. Most platforms use traded volume. Some use TPOs (time at price), which is technically a market-profile concept rather than a volume-profile one. The two POCs usually sit close to each other but not always — see “Volume POC vs Market Profile POC” below.
The POC GoCharting plots on its volume profile charts is a true volume POC: contracts at price, summed and ranked.
Why the POC Acts as a Magnet
Traders talk about the POC “pulling” price back to it. The mechanism is real and worth understanding rather than treating it as superstition.
Anyone who entered near the POC has, by definition, lots of company at that price. Big participants who built positions there will defend the level: longs have stops below, shorts have stops above, both sides will add or trim around the same number. As long as the underlying premise of the auction has not changed — same regime, same news backdrop — the level keeps acting as a centre of gravity.
This is also why a POC that gets violated cleanly is so useful. It says the auction premise has changed, and the participants who built positions there are now offside. Their unwinding becomes the fuel for the next move. Also Read: What is Order Flow Trading?
Naked POCs: The Untested Magnet
A “naked” POC — sometimes called a virgin or untested POC — is a prior session’s POC that price has not yet returned to. It is unfinished business: a level the market accepted as fair but then walked away from without retesting. Traders track naked POCs because they tend to act as magnets days, sometimes weeks, after they form.
The reasoning is the same as for any POC, with one twist. Because nobody has had the chance to retest, all the participants who positioned around that level are still waiting. The first time price comes back, the level either holds or fails — and either way it usually generates a trade. Once the naked POC has been tested and absorbed into a new session’s profile, it loses its special status and becomes just another high-volume node.
Practically, a trader will mark every naked POC from the last five to ten sessions on the chart and watch how price behaves around them. When two or three naked POCs cluster within a few ticks of each other, the magnet effect is amplified. Also Read: Volume Profile: The Ultimate Guide
POC, VAH and VAL: The Triangle You Actually Trade
The POC rarely trades alone. It anchors the value area, the price band that contains roughly 70% of the session’s volume. The top of that band is the value area high (VAH); the bottom is the value area low (VAL). Together POC, VAH and VAL form the triangle most volume-profile traders mark on every chart.
Three reflexes follow from that:
Inside value, you fade. When price is bouncing between VAH and VAL with the POC in the middle, the market is in balance. Mean-reversion trades — fade the edge back to the POC — pay the most.
At value-area edges, you decide. A test of VAH or VAL is the market’s question: do we extend or do we accept? If price spikes through and immediately gets rejected, you take the fade. If volume confirms and the bar closes outside, you have a value-area breakout and you trade with it toward the next reference level.
Through the POC, you reassess. A clean break of the POC inside the value area is rarer than people think. When it happens, it usually means the day’s auction is rotating — the POC is about to migrate to a new price. Traders who held the old POC as support will either get squeezed or get a clean second chance at the new one.
Three POC Setups That Repeat
1. The POC Hold (acceptance)
Price returns to a prior session’s POC after some excursion. The first touch produces a slowdown — bars get smaller, delta flips from one-sided to balanced, footprint imbalance dies. Entry: at the level, with a stop a few ticks the wrong side of it. Target: the prior session’s VAH or VAL depending on the direction you came from.
This is the bread-and-butter naked-POC trade. It works because the level is doing exactly what auction theory predicts: re-establishing acceptance.
2. The POC Failure (rejection-then-momentum)
Same setup, opposite outcome. Price tests the POC and fails to hold — a single oversized bar takes it through, footprint shows aggressive one-sided print, delta confirms. Entry: on the close of the breakdown bar or on a small retest of the broken level. Target: the next high-volume node beyond.
This setup pays well because the trapped participants who defended the POC are now stops to be hit. Also Read: Key Indicators for Order Flow Trading: Identifying Market Sentiment
3. The POC Migration (developing POC)
Less talked about, more powerful when you spot it. Through the trading session, the developing POC — the POC of the volume profile as it forms in real time — moves. If price is trending and the developing POC moves with it (each new bar shifts the POC higher, or lower), the market is voting with volume. That migration is one of the cleanest trend-confirmation signals on the volume profile, and it pairs naturally with cumulative volume delta for confirmation.
POC on Different Timeframes
A POC is meaningful only relative to the session it was measured in. The intraday trader cares about today’s developing POC and yesterday’s POC. The swing trader cares about the weekly POC. The position trader builds composite profiles around major moves and watches those POCs as multi-month reference levels.
What changes between timeframes is not the concept but the noise floor. A 15-minute POC will move every few bars and is almost meaningless on its own — you would use it only as part of a micro-rotation read. A daily POC moves once per session and is one of the most reliable single levels you can trade. A weekly POC barely moves at all but, when it does, the move tells you something structural about how the auction is migrating week-on-week.
For Indian-market intraday traders on Nifty or Bank Nifty, the previous day’s POC plus the developing POC of the current session is usually enough. Add the weekly composite POC for context and you have a full hierarchy of reference levels without clutter.
Volume POC vs Market Profile POC: The Subtle Difference
Two different POCs exist depending on what you measure. The volume POC is the price with the most contracts traded. The market profile POC is the price with the most TPOs — that is, the price the market spent the most time at. When volume is uniform across the session they sit at the same level; when one side of the session traded heavy and the other side traded light, they can diverge by several ticks.
For most setups the difference does not change the trade. When it does — the market profile POC is at one level and the volume POC is a few ticks away — you have two reference points instead of one, often bracketing a small zone where the next reaction happens. Treat the gap as the high-conviction area rather than picking one over the other. Also Read: Market Profile Indicator – A Comprehensive Guide and the broader Market Profile Trading: The Complete Guide.
Common Mistakes Traders Make at the POC
Three mistakes produce most of the bad POC trades.
Trading the level without context. The POC is an attractor, not a signal. A POC test in a roaring trend day is a continuation pause, not a reversal. A POC test at the end of a balanced rotation day is a fade. Same level, different trade. Profile shape and prior-day type tell you which one you are looking at.
Using too many POCs at once. Every timeframe has a POC. If you mark them all, every chart becomes spaghetti. Pick the two or three most relevant — typically prior-day, developing, and weekly composite — and ignore the rest until they become relevant.
Confusing POC with VWAP. Both are central-tendency measures and both attract price, but they answer different questions. VWAP is the volume-weighted average across the session; POC is the single most-traded price. They can sit far apart in trending sessions. Use VWAP for the average; use POC for the auction’s vote.
Trading the POC on GoCharting
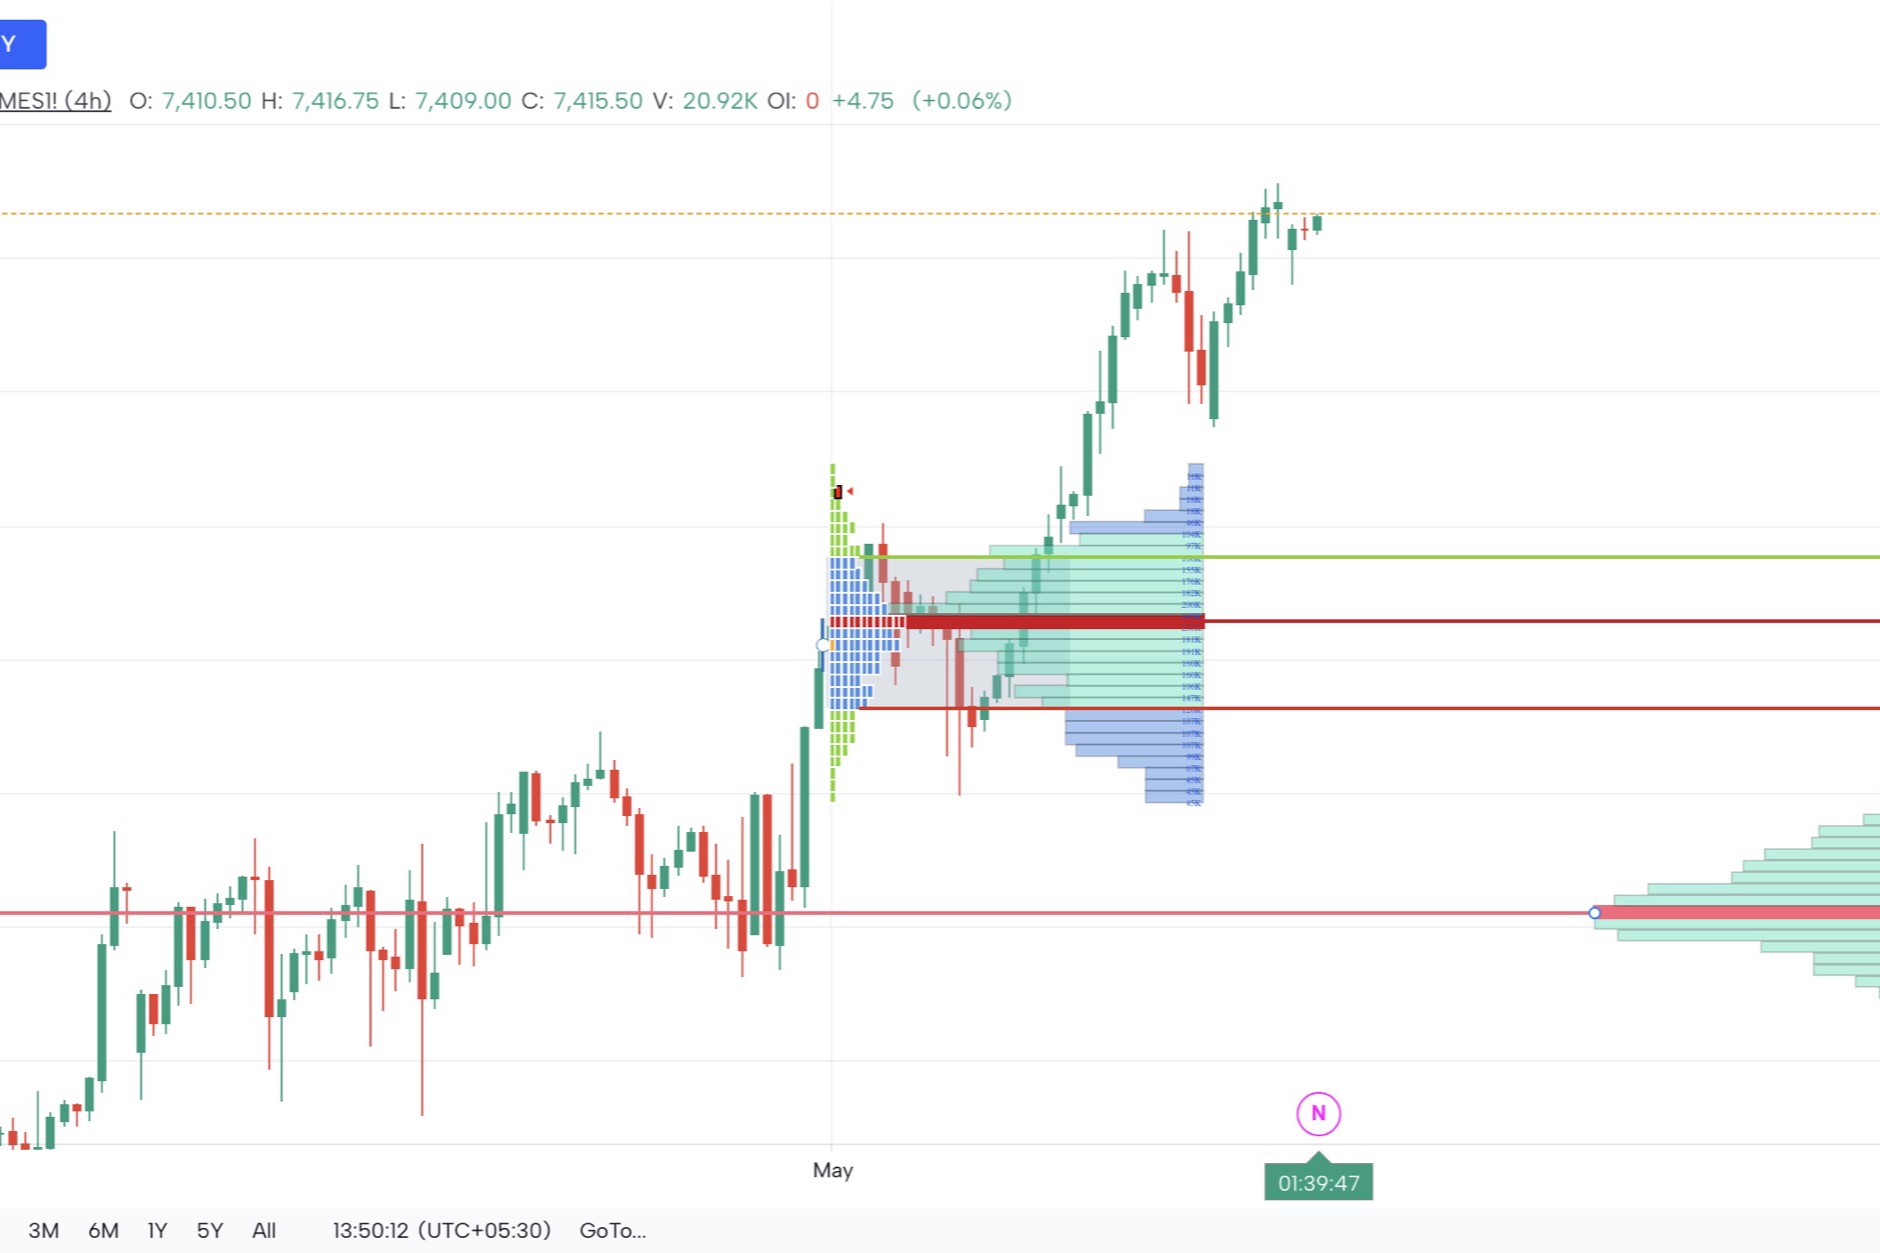
GoCharting plots the volume profile and developing POC natively on its charts, with naked-POC tracking across configurable lookback windows. You can switch between session, weekly and composite profiles, set custom row sizes by instrument, and overlay value-area boundaries to see the full POC/VAH/VAL triangle as it develops in real time. The same chart supports footprint and cluster views so the order-flow context behind every POC test is one click away — the slowdown, the absorption, the delta print that turns a level into a trade.
Conclusion
The Point of Control is one of the few price levels every serious order-flow trader marks. It is not a magic line — it is the auction’s way of telling you where the market last agreed on fair value. Traded with context — the right session, the right profile shape, the right confirmation from delta or footprint — it produces some of the highest-probability setups on the chart. Naked POCs above all: they are unfinished business that the market almost always comes back to settle.
Frequently Asked Questions
1. Is the Point of Control a support or a resistance level?
It is both, depending on which side of it price approaches from. The POC is a magnet that attracts price; whether it acts as support or resistance is decided by the direction of the test and the order-flow reaction at the level.
2. How is the POC different from VWAP?
VWAP is the volume-weighted average price across a session — a single line that moves bar by bar. The POC is the single most-traded price in the session — a fixed level until enough new volume prints elsewhere to shift it. VWAP gives you the average; the POC gives you the most popular price.
3. What is a naked POC?
A naked POC is a prior session’s POC that price has not yet returned to. Because the level was accepted as fair value but never retested, traders watch it as a high-probability magnet for future price action.
4. How long does a naked POC stay relevant?
Most order-flow traders track naked POCs from the past five to ten sessions. After that the structural context has usually changed enough that older levels lose their pull.
5. Can I trade the POC on indices like Nifty and Bank Nifty?
Yes. The previous-day POC plus the developing POC of the current session is one of the cleanest intraday reference frameworks for Nifty and Bank Nifty futures. Add a weekly composite POC for the swing context.
📖 Related Documentation
📝 Related Blog Posts
- Market Profile Trading: The Complete Guide
- Market Profile Indicator – A Comprehensive Guide
- Volume Profile: The Ultimate Guide
- Footprint Charts – The Complete Trading Guide
- Auction Market Theory For Day Trading